
 ) or https:// means you've safely connected to the .gov website. Share sensitive information only on official, secure websites.
Vulnerability Visualizations
The NVD hosts four visualizations for data found from vulnerabilities.
Description Summary Word
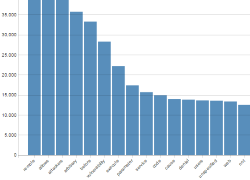
|
Similar to the word cloud on the main visualization page, the visualization below was generated by calculating the frequency of words (common words such as "the" and "a" were excluded) that were part of the vulnerability summary description. |
CVSS Severity Distribution Over Time
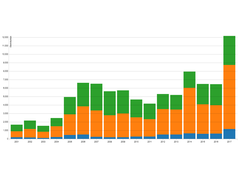
|
This visualization is a simple graph which shows the distribution of vulnerabilities by severity over time. The choice of LOW, MEDIUM and HIGH is based upon the CVSS V2 Base score. |
CWE Over Time
There are two visualizations for the monitoring of vulnerability categories over time:
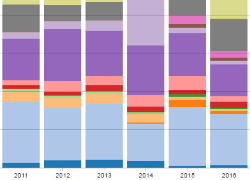
|
Relative Vulnerability Type Totals By YearThe vulnerabilties in the NVD are assigned a CWE based on a slice of the total CWE Dictionary. The visualization below shows a stacked bar graph of the total number of vulnerabilities assigned a CWE for each year. It is possible (although not common) that a vulnerability has multiple CWEs assigned. |
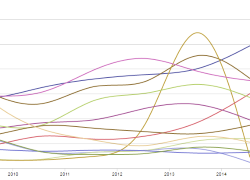
|
Vulnerability Type Change by YearThis visualization is a slightly different view that emphasizes how the assignment of CWEs has changed from year to year. |